Building Comfort
15 minute read
Imagine you manage a building and want to know — the instant it happens — when any room becomes uncomfortable: too hot, too cold, or stuffy with CO2. You don’t want to poll sensors on a timer or wire up a stream processor by hand. You just want to describe what “uncomfortable” means and have something watch every room, floor, and the whole building for you, continuously.
This tutorial builds a Building Comfort monitoring app on @drasi/lib, the
Node.js library that embeds the Drasi continuous-query engine directly in your process.
A PostgreSQL database holds a building made of floors and rooms, each room reporting
temperature, humidity, and co2. A single Node app connects to the database, runs
six continuous queries, and streams the results to a live web UI over
Server-Sent Events.
You’ll change room readings and watch everything react in real time.
Unlike the Drasi Server tutorial
this is based on, there is no separate server to run and no built-in dashboard reaction.
Instead, the app embeds the engine and adds Drasi’s SSE reaction (kind: sse): it shapes
each query change with Handlebars templates and streams it to the browser over Server-Sent
Events, driving a custom web UI. That UI adds controls the dashboard reaction doesn’t have —
toggle a simulator, and reset or set any room — all from the page.
What you’ll build: a running Node app that embeds Drasi, connects to PostgreSQL, and reacts to room sensor changes in real time, assembled from Drasi’s three core building blocks:
| Step | What You’ll Do | Time |
|---|---|---|
| Step 1: Set Up Your Environment | Open the dev container (or install Node + Docker locally) | 5 min |
| Step 2: Run the Demo | One command starts PostgreSQL and the app | 3 min |
| Step 3: Open the UI | Watch comfort levels and alerts live | 2 min |
| Step 4: Drive Change | Break, reset, set, and simulate rooms — and watch Drasi react instantly | 5 min |
| How It Works | Understand the source, the six queries, the synthetic joins, and the SSE reaction | 5 min |
- Terminal: you’ll use one to run the app (it stays in the foreground). Everything else happens in your browser. You can optionally use a second terminal for the helper scripts that change data.
- Working directory: run every command from the tutorial directory
(
tutorials/building-comfort/). The dev container opens there automatically; if you’re running locally,cd tutorials/building-comfortfirst. - Ports: the web UI is on
3000and PostgreSQL is published on5732. The SSE reaction runs inside the app on8081, but the app multiplexes it into the UI’s/eventsstream, so only3000needs to be reachable.
Step 1 of 4: Set Up Your Environment
The easiest way to follow this tutorial is the dev container, which installs everything for you. You can also run locally if you prefer.
Option A: Dev Container or GitHub Codespaces (recommended)
This repo has several tutorial dev containers. Codespaces does not ask which one to use if you click Create codespace on the default Code menu — pick the configuration explicitly (or use the link below).
GitHub Codespaces: Open this Codespaces link (it selects Drasi Node.js — Building Comfort Tutorial for you).
Or from the repo page: Code → Codespaces → … next to Create codespace on main → New with options…, set Dev container configuration to Drasi Node.js — Building Comfort Tutorial, then create the codespace.
VS Code (local): Open the
drasi-nodejsrepository and run Dev Containers: Reopen in Container. When prompted for a configuration, choose Drasi Node.js — Building Comfort Tutorial.Wait for the container to finish. Its setup script installs Node dependencies for the tutorial.
That’s it — skip ahead to Step 2.
Option B: Run Locally
You’ll need Node.js 18+, Docker (for PostgreSQL), and bash (for the optional helper scripts; on Windows use Git Bash or WSL). From the repository root, move into the tutorial directory and install its dependencies:
cd tutorials/building-comfort
npm install
@drasi/lib ships prebuilt binaries, so there’s no Rust toolchain to install — npm
resolves the correct native addon for your platform. (Intel macOS has no prebuilt binary
and must build from source; see the library docs.)
Step 2 of 4: Run the Demo
Everything runs from a single command. In your terminal, start the demo:
npm run demo
npm run demo does two things: it starts PostgreSQL (seeding one building, three floors,
and nine rooms — every room comfortable to begin with) and then runs the Node app in the
foreground.
On first start, the app downloads the Drasi plugins it needs (source/postgres,
bootstrap/postgres, and reaction/sse) from ghcr.io/drasi-project with installPlugin, which
resolves each one to the build that matches your platform and this library version, connects to
the database, and starts the six continuous queries and the SSE reaction. When you see this line,
it’s ready:
✅ Building Comfort is ready — open http://localhost:3000
Leave this running. Everything else happens in your browser (or an optional second terminal).
Press Ctrl+C in the terminal to stop the app. To remove the database container when
you’re completely done, run bash scripts/cleanup.sh (add --volumes to also delete the
data). The database keeps running between app restarts, so you can stop and start the app
freely.
Step 3 of 4: Open the UI
The app serves its own web UI — there’s no separate front end to build or run. Wait
until the terminal prints Building Comfort is ready (on the first run this takes
~30 seconds while the plugins download), then open it in your browser:
http://localhost:3000
In the dev container or Codespaces, port 3000 is forwarded automatically — VS Code
shows a notification when the UI is ready, and you can also open it from the Ports
panel (the Comfort UI entry). If you open the page before the app has finished
starting, just refresh once it’s ready.
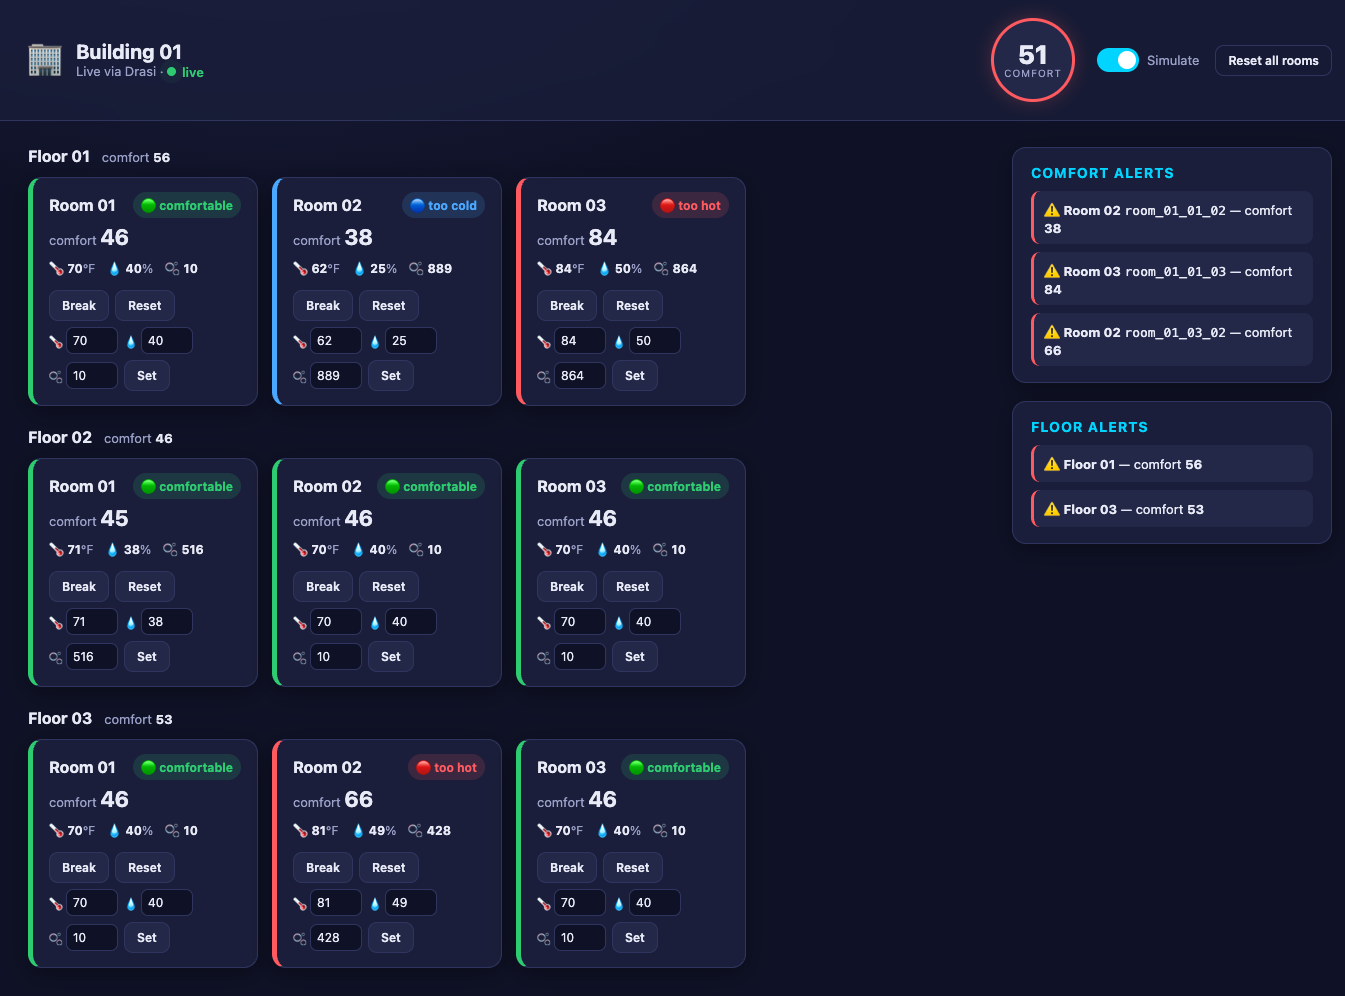
You’ll see the Building Comfort UI:
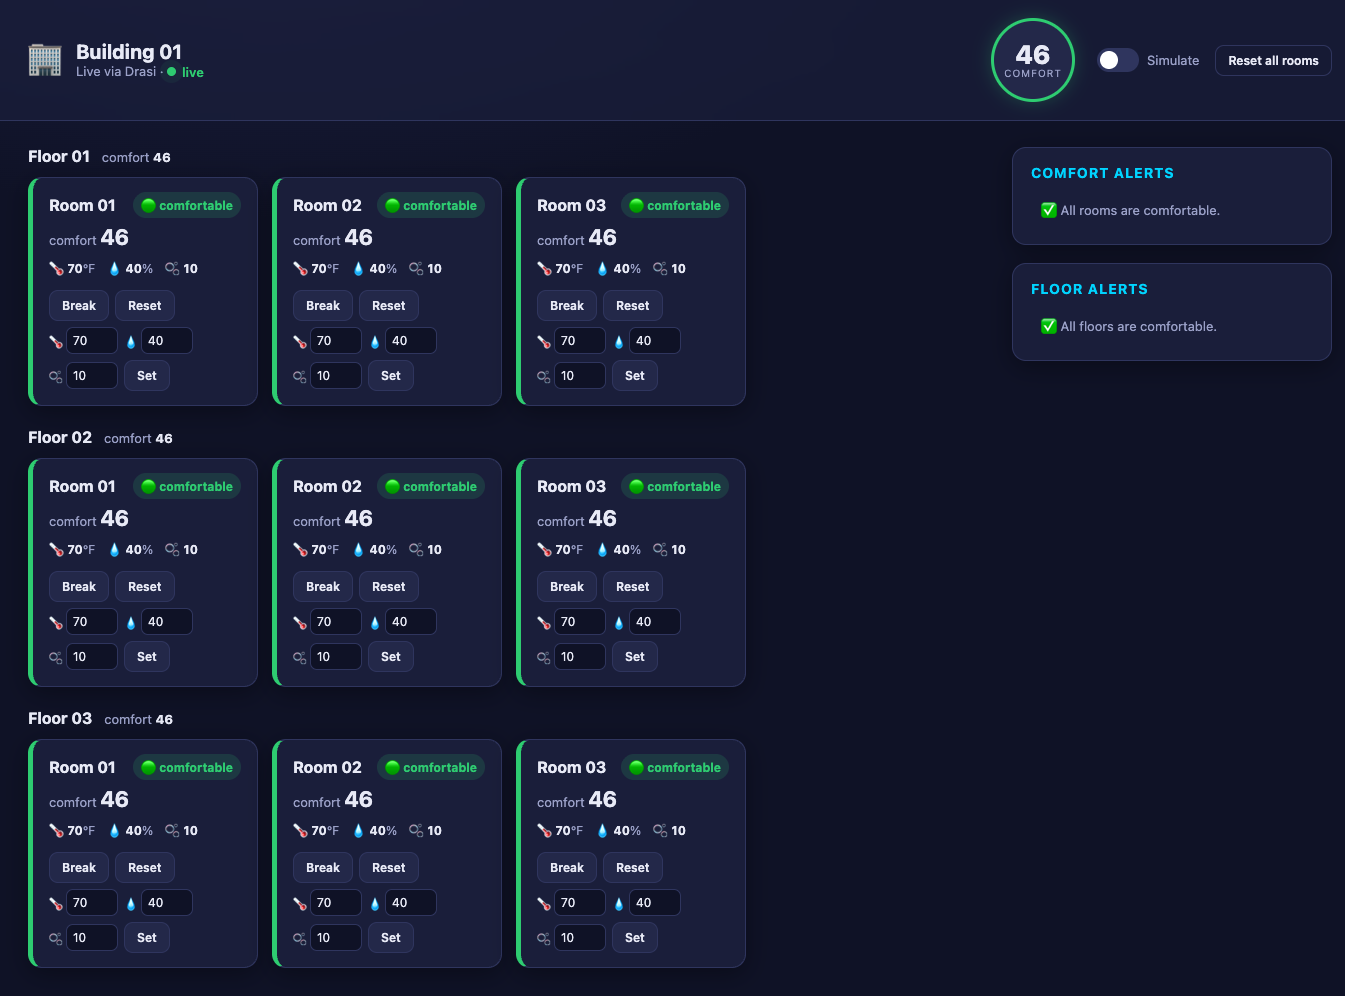
- The building (the large panel) — rooms grouped by floor, each showing its comfort
level, a status badge, and its sensor readings. Every room starts at comfort
46(comfortable). Each room card also has Break, Reset, and Set controls. - Overall comfort — the gauge in the header shows the building’s average comfort level, tinted green, red, or blue.
- Comfort Alerts and Floor Alerts — empty for now; rooms and floors appear here only when they need attention.
- Simulate toggle and Reset all rooms button — in the header.
Each room card carries its own controls — the readings, a live comfort level, and Break / Reset / Set:
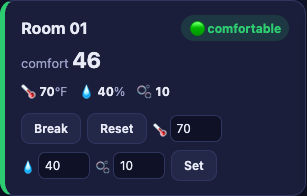
The UI updates the instant the data changes — no refreshing. Let’s make something change.
Step 4 of 4: Drive Change
With the app running and the UI open, change room readings from the UI and watch every panel react.
Every control in the UI does exactly one thing: a plain SQL UPDATE against PostgreSQL —
exactly what an existing building-management app would already do. The button posts to the
app, which runs the UPDATE; there’s no event to publish and no call into Drasi. Drasi
observes the row change through PostgreSQL’s logical replication (CDC), re-evaluates the
affected queries, and the SSE reaction re-shapes and pushes the snapshot on its own.
Break a room
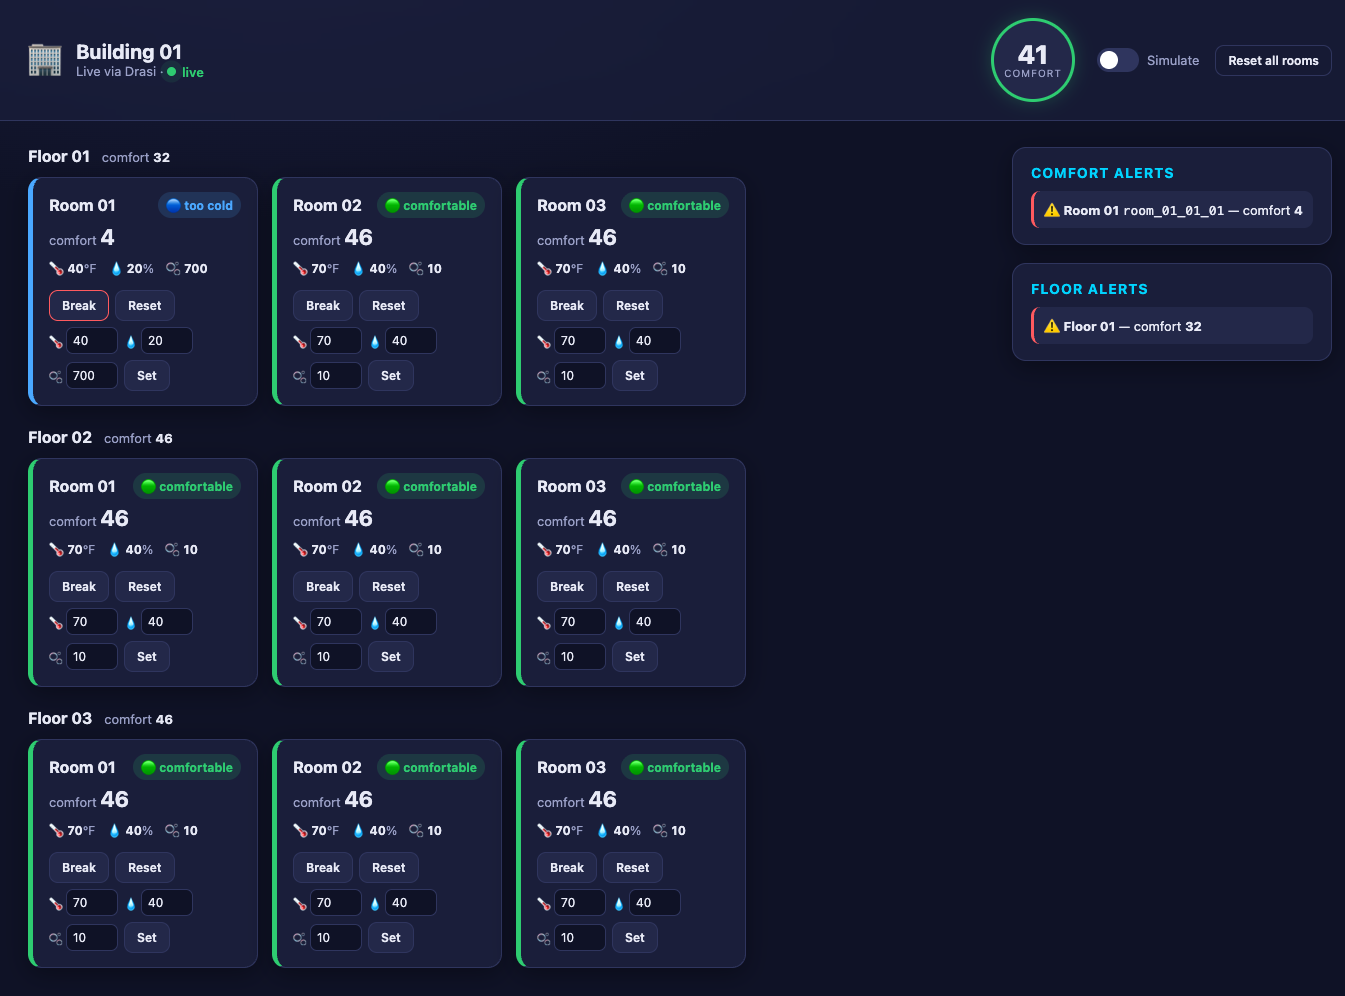
Click Break on any room card. It pushes that room out of the comfortable band (sets
temperature = 40, humidity = 20, co2 = 700).
Within about a second the whole UI reacts: the room’s card turns blue (too cold — its
comfort level drops to 4), its floor’s average falls, the header gauge drops, and entries
appear in Comfort Alerts and Floor Alerts. The browser computed none of that — each
panel is a continuous-query result the SSE reaction shaped and pushed.
Set custom values
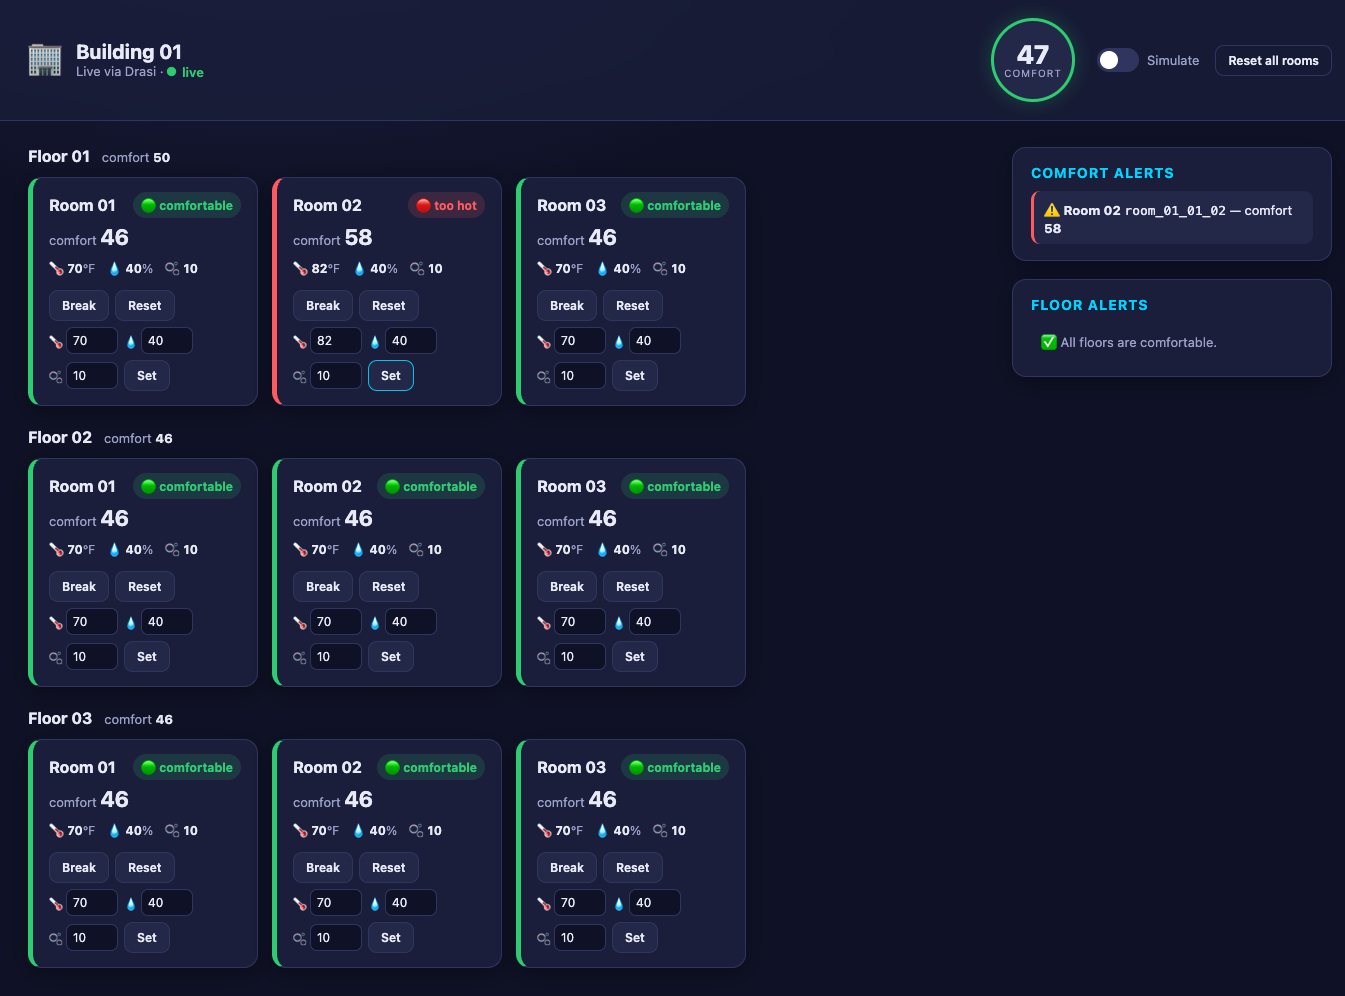
Each room card has three inputs (🌡️ / 💧 / 🫧) and a Set button. Try partial
degradation — make a room too hot without touching humidity or CO₂: set the temperature to
82 and click Set. That gives 50 + (82-72) + (40-42) + 0 = 58 — above 50, so the
room turns red and raises a Comfort Alert, while its floor (whose average is exactly
50) stays just inside the band and raises no Floor Alert.
Reset a room (or all rooms)
Click Reset on a room card to return it to comfortable defaults (70 / 40 / 10), or
Reset all rooms in the header to reset the whole building. The alerts clear and every
panel returns to green.
Let it run hands-free
Flip the Simulate toggle in the header. The app picks a random room every few seconds and assigns new readings, so comfort levels rise and fall and alerts come and go on their own — a live stress test of the whole pipeline. Flip it off to stop, then click Reset all rooms.
Because every change is just a database write, you can drive the exact same reactions with
psql from a second terminal — no app endpoint involved:
docker exec building-comfort-nodejs-postgres psql -U drasi_user -d building_comfort \
  -c "UPDATE \"Room\" SET temperature = 40, humidity = 20, co2 = 700 WHERE id = 'room_01_01_01';"
Watch the UI react exactly as if you had clicked Break.
How It Works
Everything you just ran is a single Node app under tutorials/building-comfort/. One file,
index.mjs, embeds the engine, builds the topology, wires the SSE reaction, and serves the
UI (the browser front end lives in public/). Here’s what each part does.
The Source
The app connects a PostgreSQL CDC source to the Building, Floor, and Room
tables:
await engine.addSource('postgres', 'building-facilities', {
  host: 'localhost',
  port: 5732,
  database: 'building_comfort',
  user: 'drasi_user',
  password: 'drasi_password',
  tables: ['Building', 'Floor', 'Room'],
  slotName: 'drasi_building_comfort_slot',
  publicationName: 'drasi_building_comfort_pub',
  tableKeys: [
    { table: 'Building', keyColumns: ['id'] },
    { table: 'Floor', keyColumns: ['id'] },
    { table: 'Room', keyColumns: ['id'] },
  ],
}, true, { kind: 'postgres', config: /* same */ });
The source uses logical replication (CDC) to stream changes, and tableKeys tells
Drasi the primary key of each table so it can track row identity. The bootstrap provider
({ kind: 'postgres' }) loads the rows that already exist when the app starts; after
that, every UPDATE flows to Drasi as a change. The table names are quoted and PascalCase
in the database so the node labels Drasi sees match the queries exactly: (r:Room),
(f:Floor), (b:Building).
The Continuous Queries
Each query computes a comfort level with the same formula. A value between 40 and
50 is comfortable; the seed values (70°F, 40%, 10 ppm) give
50 + (70-72) + (40-42) + 0 = 46.
floor( 50 + (r.temperature - 72) + (r.humidity - 42)
      + CASE WHEN r.co2 > 500 THEN (r.co2 - 500) / 25 ELSE 0 END )
There are six queries, each registered with its own addQuery call:
| Query | What it returns |
|---|---|
building-comfort-ui | One row per room with its comfort level — the feed that drives the building view |
building-comfort-level-calc | The building’s overall comfort level |
floor-comfort-level-calc | Each floor’s average comfort level |
room-alert | Only the rooms whose comfort is outside 40–50 |
floor-alert | Only the floors whose average comfort is outside 40–50 |
building-alert | The building, when its overall comfort is outside 40–50 |
The SSE reaction streams five of these — the per-room feed, the per-floor and building comfort
rollups, and the room and floor alerts — to the UI, each on its own path (building-alert
isn’t shown in this UI). The floor and building queries are aggregations: avg() inside a
WITH rolls room comfort up to floors and the building, and the reaction streams their changes
just like any other query.
Synthetic joins connect the entities
PostgreSQL knows Room.floor_id references Floor.id through a foreign key, but Drasi
doesn’t read foreign keys. Instead, each query declares the relationships it needs as
synthetic joins, so the Cypher can walk from room to floor to building:
const PART_OF_FLOOR = {
  id: 'PART_OF_FLOOR',
  keys: [
    { label: 'Room', property: 'floor_id' },
    { label: 'Floor', property: 'id' },
  ],
};
const PART_OF_BUILDING = {
  id: 'PART_OF_BUILDING',
  keys: [
    { label: 'Floor', property: 'building_id' },
    { label: 'Building', property: 'id' },
  ],
};

await engine.addQuery(id, cypher, ['building-facilities'], 'cypher',
  [PART_OF_FLOOR, PART_OF_BUILDING]);
With those joins declared, a query can match the whole hierarchy:
MATCH (r:Room)-[:PART_OF_FLOOR]->(f:Floor)-[:PART_OF_BUILDING]->(b:Building)Aggregating up the hierarchy
Half of the queries don’t just read rooms — they roll comfort levels up the building.
In a Continuous Query, an aggregate such as avg() inside a WITH groups by whatever
non-aggregated values travel alongside it, exactly like SQL’s GROUP BY.
One stage — average a floor’s rooms. floor-comfort-level-calc keeps the floor f in
the WITH, so avg() produces one value per floor:
WITH f, floor( 50 + (r.temperature - 72) + ... ) AS RoomComfortLevel
WITH f, avg(RoomComfortLevel) AS ComfortLevel
RETURN f.id AS FloorId, ComfortLevel
Two stages — average the averages. building-alert aggregates twice. Carrying
f, b groups the first avg() by floor; dropping f from the next WITH widens the
grouping so the second avg() rolls the floor averages up into a single building level:
WITH f, b, avg(RoomComfortLevel) AS FloorComfortLevel   // rooms  -> floor
WITH b,    avg(FloorComfortLevel) AS ComfortLevel        // floors -> building
Filtering on an aggregate. The floor-alert and building-alert queries place a
WHERE after the aggregation — like SQL’s HAVING — so a floor or the building only
shows up while its average is outside the comfortable band:
WITH f, avg(RoomComfortLevel) AS ComfortLevel
WHERE ComfortLevel < 40 OR ComfortLevel > 50
RETURN f.id AS FloorId, ComfortLevel
Because these are continuous queries, the aggregates are maintained incrementally: when one room’s reading changes, Drasi recomputes only the affected floor and building averages and emits just that change — it never rescans every room.
The SSE Reaction (kind: sse)
This is where the Node version differs most from the Drasi Server tutorial’s dashboard
reaction — but the mechanism is the same built-in SSE reaction the
Getting Started tutorial uses.
The app loads the reaction/sse plugin from the OCI registry and adds it with
addReaction.
The reaction opens an HTTP endpoint and streams each subscribed query’s result changes
to the browser over Server-Sent Events.
Crucially, the SSE reaction shapes each change with a Handlebars template before sending
it — no reaction code of our own required. We give each query its own routes entry with
added / updated / deleted templates that rename the raw query columns into the clean
JSON contract the UI wants:
await engine.addReaction('sse', 'building-comfort-sse', [
  'building-comfort-ui', 'floor-comfort-level-calc', 'building-comfort-level-calc',
  'room-alert', 'floor-alert',
], {
  host: '0.0.0.0',
  port: 8081,
  heartbeatIntervalMs: 15000,
  routes: {
    'building-comfort-ui': {
      added:   { path: '/rooms', template: '{"op":"add","row":{"id":{{json after.RoomId}},"name":{{json after.RoomName}},"floor":{{json after.FloorName}},"comfort":{{json after.ComfortLevel}}, ... }}' },
      updated: { path: '/rooms', template: '{"op":"update","row":{ ... {{json after.Temperature}} ... }}' },
      deleted: { path: '/rooms', template: '{"op":"delete","row":{"id":{{json before.RoomId}}}}' },
    },
    'floor-comfort-level-calc': { /* added/updated/deleted → /floor-comfort */ },
    'room-alert':               { /* added/updated/deleted → /room-alerts */ },
    // ...one entry per streamed query
  },
});
{{json ...}} is one of the reaction’s Handlebars helpers; it serializes each value as valid
JSON. In the code, a small sseRoute(path, shape) helper turns each query’s row shape into
those three templates, and the same shapes drive a matching reshaper for the initial snapshot —
so the browser sees an identical payload whether it arrives as a live change or in the seed. The
aggregate queries (floor-comfort-level-calc, building-comfort-level-calc, floor-alert)
stream exactly the same way — the reaction renders their avg() changes through the updated
template, keyed by floor or building id.
Because SSE only carries changes from the moment a client connects, the app also serves
the current state once at GET /api/state (built from getQueryResults, shaped through the
same contract). The browser seeds from that snapshot, then applies live deltas.
Finally, the SSE reaction listens on its own port (8081) and serves each query on its own
route. Rather than have the browser open one EventSource per route — which, with the
browser’s ~6-connections-per-host HTTP/1.1 limit, would eat into the connections the control
fetch()es need — the app opens all of those routes itself and multiplexes them into a
single same-origin stream at GET /events. Each forwarded event is
tagged with its stream path ({ "path": …, "msg": { op, row } }). Node has no such per-host
limit, and only one port needs forwarding in Codespaces or a dev container.
The Web UI
The front end (public/) is a single HTML page with vanilla CSS and JavaScript — no build
step. On load it seeds itself from /api/state, then opens one EventSource at /events and
merges each { op, row } change into the map for its path:
const source = new EventSource('/events');
source.onmessage = (e) => {
  const { path, msg } = JSON.parse(e.data); // path names the stream
  const { op, row } = msg;
  const map = state[path];
  if (op === 'delete') map.delete(row.id);
  else map.set(row.id, row);
  render();
};
It renders the building grid from the room feed and the gauge, floor-comfort labels, and alert
lists straight from their streams, and its controls (Break / Reset / Set,
Reset all rooms, Simulate) call the app’s small control endpoints
(POST /api/rooms/:id, POST /api/reset, POST /api/simulate). Those endpoints write to
PostgreSQL — so a click becomes a database change that Drasi observes through CDC, re-runs the
affected queries, and the SSE reaction pushes the shaped change back to the browser, closing
the loop.
Clean Up
When you’re finished, stop the app with Ctrl+C, then remove the database container:
# Stop containers, keep data
bash scripts/cleanup.sh

# Stop containers and delete the data volume
bash scripts/cleanup.sh --volumes
What You Learned
- Sources connect Drasi to live data — here, PostgreSQL via Change Data Capture,
embedded directly in a Node app with
@drasi/lib. - Continuous Queries with synthetic joins let you model relationships (room → floor → building) and compute derived values (comfort levels) that stay current automatically.
- Reactions turn query changes into action. Drasi’s SSE reaction (
kind: sse) shaped each change with Handlebars templates and streamed it over Server-Sent Events to a custom UI — full control over the markup, with no reaction code of your own. - Because Drasi emits only what changed, everything updates the instant the data does, with no polling.
From here, try editing the comfort formula, changing the Handlebars templates, adding a new
alert query, or pointing the app at your own data — it’s all in one file, index.mjs.
Feedback
Was this page helpful?
Glad to hear it! Please tell us how we can improve.
Sorry to hear that. Please tell us how we can improve.